
“You mustn’t be afraid to dream a little bigger, darling.”
Inception, 2010
At JPMorgan’s Investor Day at the end of May, CEO Jamie Dimon stated that buying back stock greatly in excess of 2x times tangible book value1 would be a mistake. Today JPMorgan trades at 2.3x tangible book value. Does that make it expensive? Not necessarily, but it is certainly no longer cheap. However, the company is still planning to buy back in excess of US$8bn of stock this year and, for what it is worth, a significant majority of sell-side analysts rate it as a buy, albeit with limited upside.
So, what is a bank worth? Ultimately, what the market is prepared to pay for it. While there are a number of ways to value a bank’s shares, the most common is taking the return on equity (RoE) and comparing it to its cost of equity adjusted for an assumed level of growth. The higher the return, all things being equal the higher the price-to-book (P/B)2 and vice versa.
Take the three banks below. For the time being we are not going to name them but they are all developed market banks; one in the US, one in Europe and one in Asia. Bank A stands out as its multiple would suggest it is doing something very special to trade at the level it does, Bank B looks more reasonable while Bank C looks undervalued.
| Return on equity | Price-to-book value | |
Bank A | 12.5% | 2.7x |
Bank B | 14.5% | 1.9x |
Bank C | 13.5% | 1.0x |
| Source: Bloomberg, Polar Capital, as at 28 May 2024. | ||
Looking at their price-to-earnings (P/E)3 ratios gives a similar picture and earnings per share (EPS) estimates are not forecasting a huge jump in earnings for Bank A or a sharp drop in earnings for Bank C to justify the difference. Dividend yields do not help. Both Bank A and Bank C were forced to significantly cut or suspend their dividends in 2020 by regulators. Capital, ditto.
| 2025 Price-to-earnings ratio | 2025 EPS forecast vs 2023 EPS | |
Bank A | 21.0x | -3.0% |
Bank B | 12.1x | -0.6% |
Bank C | 6.6x | -4.5% |
| Source: Bloomberg, Polar Capital, as at 28 May 2024. | ||
Even delving into the funding franchise of each bank would not help as Bank A is the bank most reliant on wholesale funding, i.e. it has fewer deposits to loans. It is also more reliant on net interest income from loans and mortgages, as opposed to fees and commissions which tend to be a less risky revenue line.
| Loans to deposits | Non-interest income as a % of revenue | |
Bank A | 107% | 15.5% |
Bank B | 54% | 43.6% |
Bank C | 89% | 43.3% |
| Source: Bloomberg, Polar Capital, as at 28 May 2024. | ||
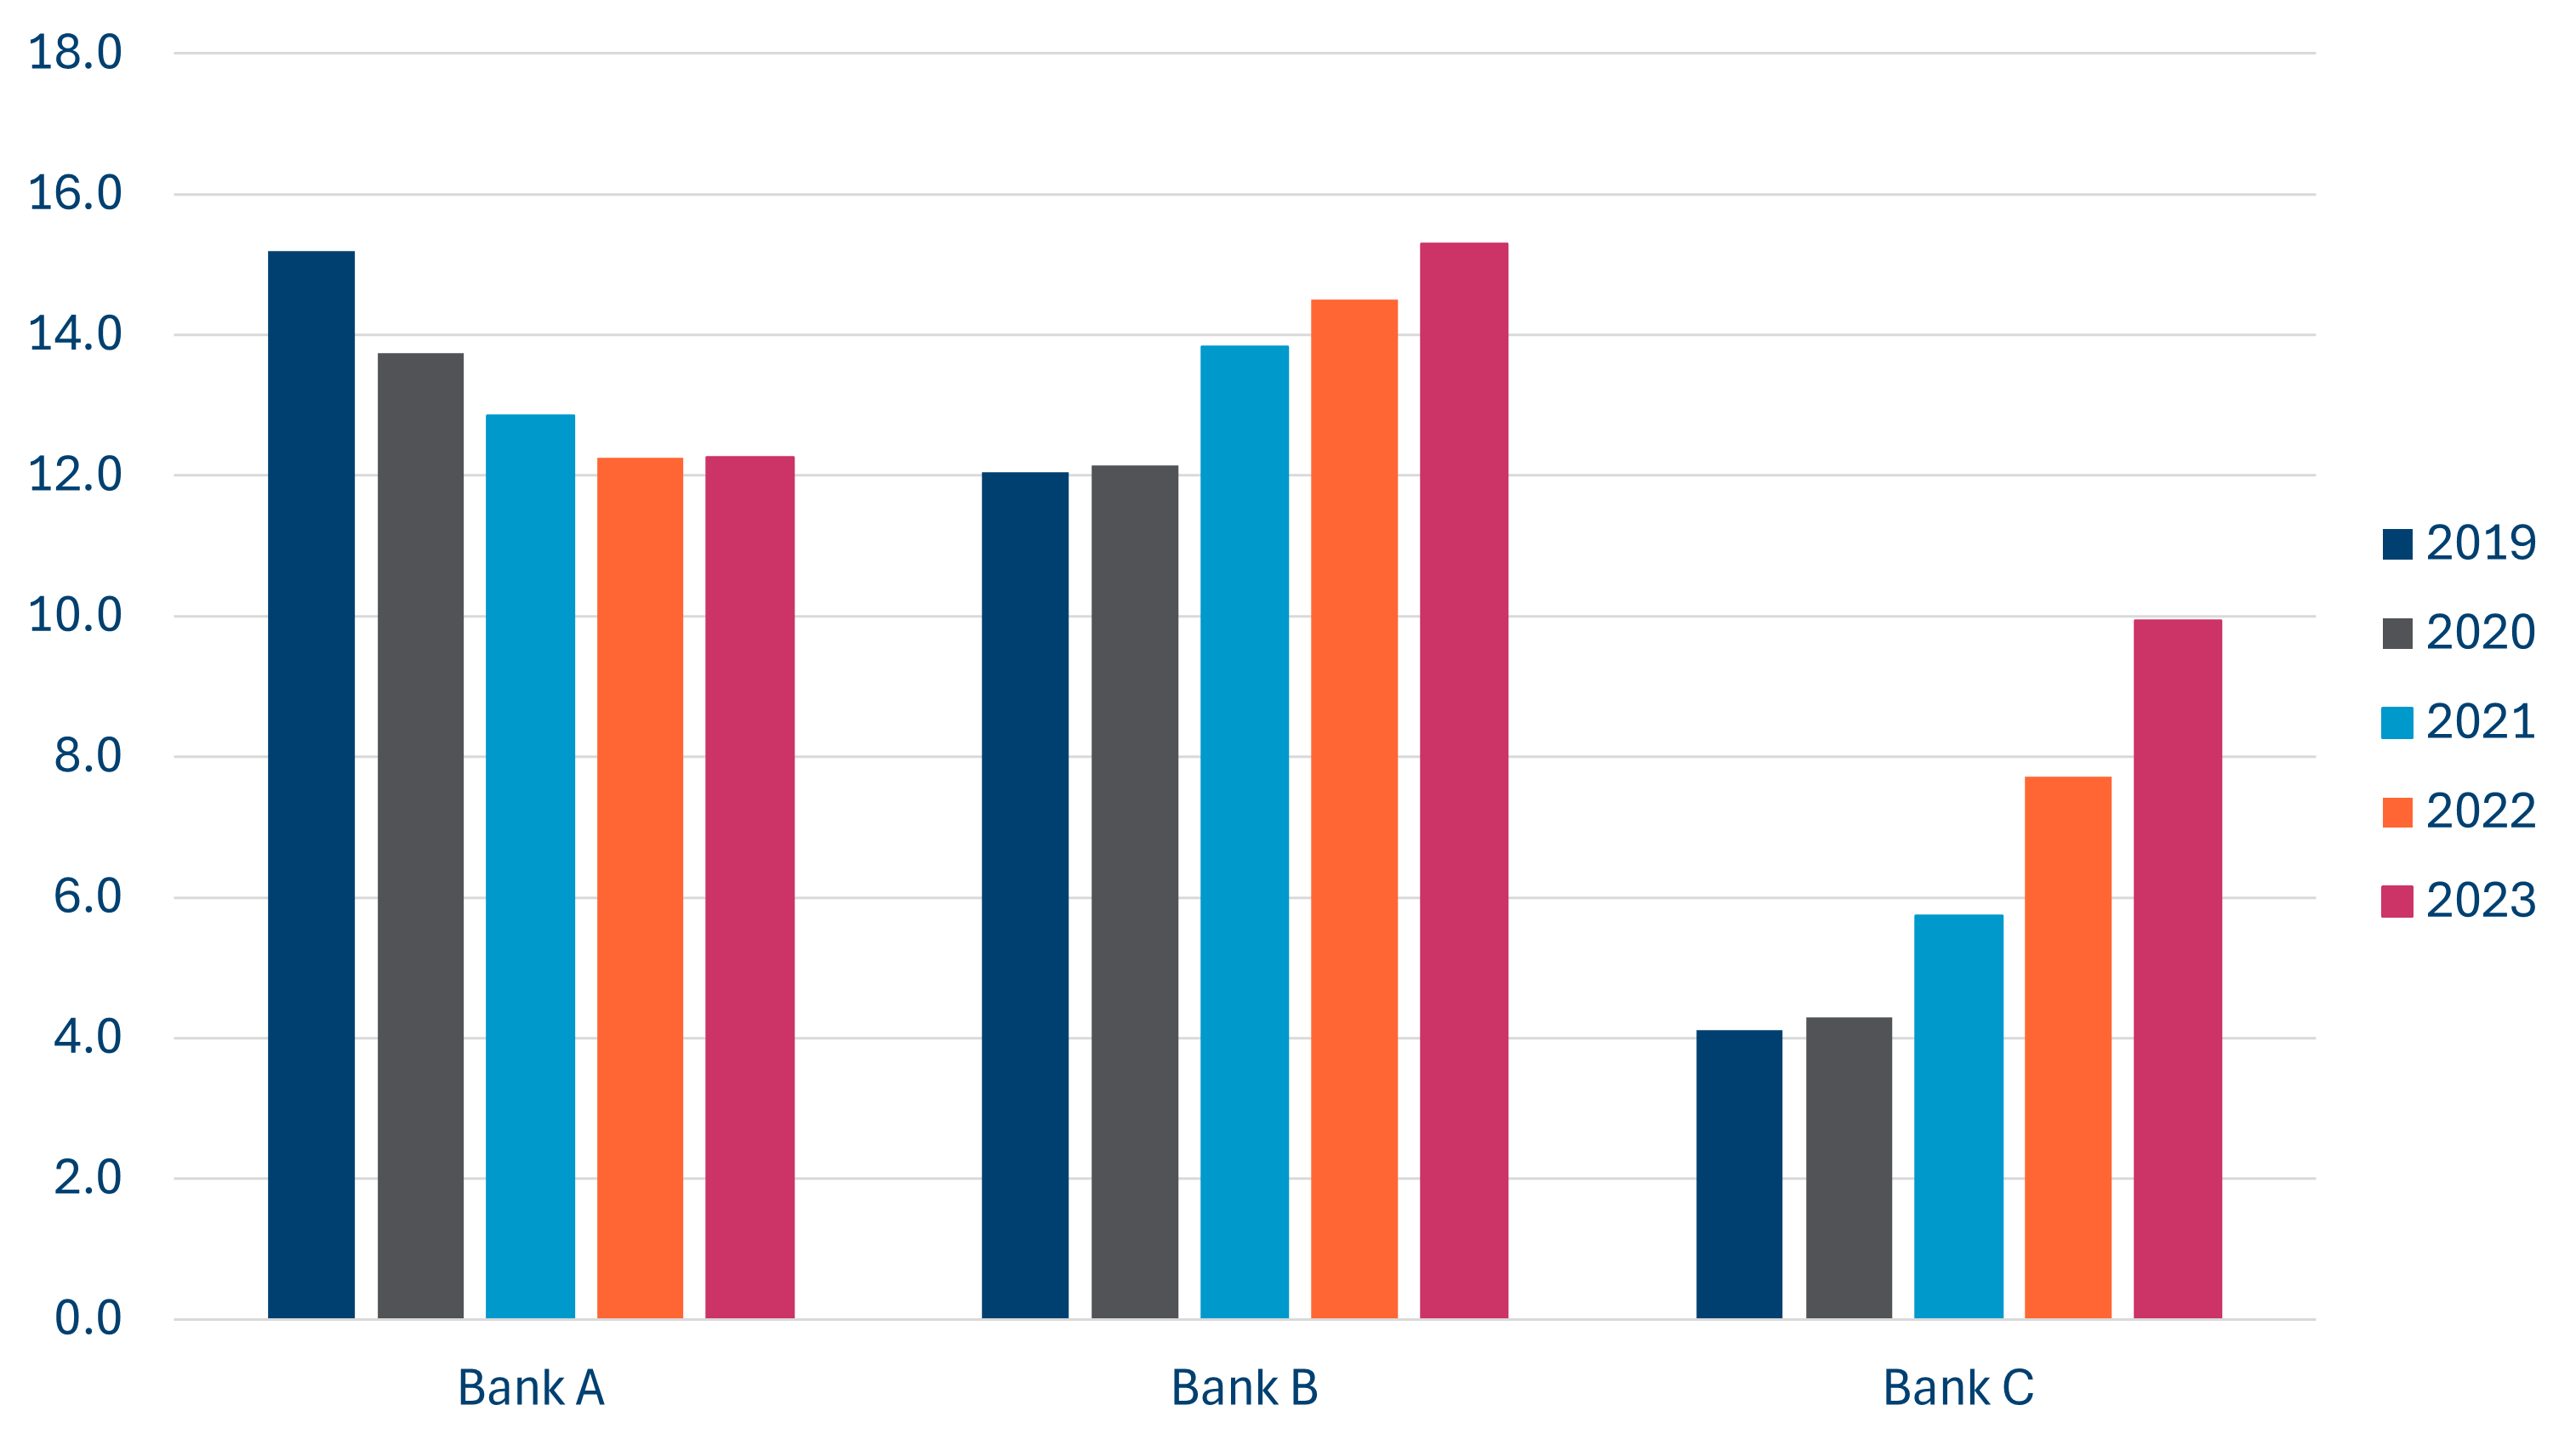
Therefore, at first glance, there is nothing to explain the differentiation. It is only when you start to look at the history of profitability (in this instance we have used the five-year average RoE) does it become clear that Bank C is the ugly duckling of the three and justifies a lower P/B ratio.
| Five-year average RoEs (%) |
 |
| Source: Bloomberg, Polar Capital, as at 28 May 2024. |
So, which banks are they? Bank A is the Commonwealth Bank of Australia (CBA)*, Bank B is JPMorgan (we have used its P/B ratio as opposed to price to tangible book for consistency with the others) and Bank C is UniCredit. UniCredit, much like many of its eurozone peers, trades below any reasonable fair value estimate outside a much sharper fall in interest rate expectations or recession.
UniCredit is Italy’s second largest bank with operations in Germany and Central and Eastern Europe as well. As with its Italian peers, asset quality has improved substantially, with bad debts down over 85% from their peak, and it is also flush with excess capital that it has committed to return to shareholders if not deployed in M&A by 2027. Its share price is up over 2.5x over the past five years. Yet, for some, Italian banks remain uninvestable.
CBA is a very good bank with the strongest deposit franchise in Australia and has a good track record, in part due to its large mortgage book and not having had the international aspirations of some of its peers. Nevertheless, its share price trades well above what we think is fair value. Bloomberg suggests we are not alone in thinking that, listing 12 ‘sell’ or ‘reduce’ recommendations from sell-side analysts and no ‘buys’ or ‘holds’, not that has had any effect on its share price performance
It has traded at a higher P/B as recently as 2015 but profitability at the time was much higher at over 18.0% that year. Nevertheless, it is an odd situation where its implied cost of equity is below that of its debt, and an analyst on their recent earnings call suggested they should be buying back their debt not their equity (you read that correctly). While the high RoE in Australian consumer banking will not be coming back anytime soon according to the CEO of ANZ, another Australian bank, a low to mid-teens return is not to be sniffed at if it can be maintained.
Turning back to JPMorgan, if one had bought its shares back in 2021 when it last traded at this valuation you would have still made a 25-35% return, demonstrating that even a relatively high P/B for a bank it is not that expensive. Reflecting the strength of its balance sheet and better management of interest rate risk, it was able to take advantage of the US regional bank crisis to buy First Republic at a very attractive level which has boosted earnings.
However, we agree buybacks are less accretive at the current valuation and that keeping more of the cash gives JPMorgan options – it has plenty of options to grow that CBA does not. It plans to open 500 new branches over the next three years, a reminder that there are only two banks in the US, namely Bank of America* and Wells Fargo, that can be argued to have a national footprint. It is also spending over US$17bn in technology this year. We believe it will continue to be a winner in the sector.
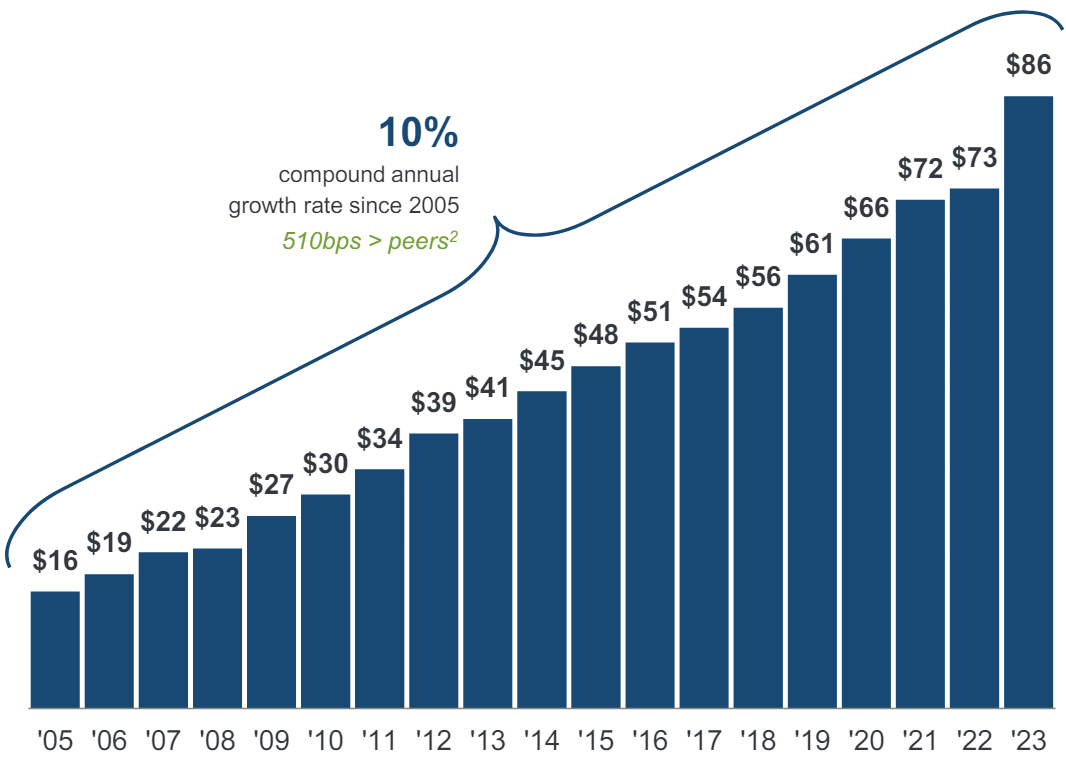
Warren Buffett is also on record as saying he thought JPMorgan’s intrinsic value was worth more than 3x tangible book in comments in 2019 though he is no longer a holder for reasons unknown, so this arguably carries less weight. However, as highlighted in their Investor Day, or as is evident from a cursory glance at the performance of its US bank peers, JPMorgan has outperformed.
| JPMorgan tangible book value per share |
 |
| Source: JPMorgan 2024 Investor Day presentation, 20 May 2024. |
So, what is CBA’s secret sauce? A part of it may have to do with the history of the bank being privatised in the early 1990s. Over 50% of its shares are still held by retail investors. That impacts liquidity, which can work both ways but has probably been a tailwind. In 2023, we estimate it bought over A$1.2bn of stock to meet its dividend reinvestment plan (DRP). However, it has been buying back stock over and above what it needs to meet the DRP as well, despite the much higher valuation.
The introduction of new accounting rules on how much banks have to set aside for provisions, namely IFRS 9 and CECL, has made bank earnings more pro-cyclical which belies the fact that more risk has shifted off balance sheet. However, until proven otherwise the markets’ Pavlov’s Dog reaction will likely be to sell bank shares at the first smell of smoke. Meanwhile Australian banks and CBA in particular trade at higher multiples than their global peers (double that of the UK on average since you asked). We believe this is in large part due to the tax advantages for Australian investors to hold Australian equities (note to UK government) and a more stable regulatory regime.
“Eames: They come here every day to sleep?
Man: No. They come to be woken up.”
Inception, 2010
* not held
1. Tangible book value measures a firm's value excluding intangible assets and goodwill.
2. P/B stands for price-to-book ratio, which measures the market's valuation of a company relative to its book value (a company's total assets minus its total liabilities). The lower a P/B the more likely a company will be perceived as undervalued and vice versa.
3. P/E stands for price-to-earnings ratio, which relates a company's share price to its earnings per share.


